Live debugging with open-source tools (Programming for ESP8266: Part 4)
Intro
Debugging is a powerful technique that allows us to understand better the inner workings and logic of an application. It can save us a lot of time and efforts during troubleshooting. Debugging on a device, like the ESP8266 microcontroller (aka ESP), is even more helpful because it facilitates us to understand how the device is actually working.
Until recently there were no powerful open-source tools that can help us debug a program running on an ESP. There is an open-source toolchain, there are open-source Integrated Development Environments (IDE) for C/C++ like Eclipse CDT, but the magic ingredient was still missing.
Thanks to the efforts of the ESP-GDBStub team this is now possible. And this article will try to help you compile an application in Debug mode for ESP8266, flash it on the device and finally make a debug session using the console line debugger GDB or a visual tool like Eclipse CDT. This article discusses software debugging only which means that there is no need for JTag devices or any additional hardware.
For simplicity and consistency with the previous articles (part 1, part 2, part 3) I will make the explanations while creating a demo app in an ESP8266 framework called Sming. Also all sample commands will be for Linux. The Espressif SDK version that was used is 1.4.0.
It should be fairly easy to adapt the steps for other applications, frameworks and operating systems.
So let’s get started.
Building Debug Version of an Application.
In order to be able to debug an application on your ESP the application has to be compiled for debug mode. This means that during compile time the compiler should add additional information in your application to facilitate the debugger. The ESP-GDBStub team suggests using -ggdb and -Og compiler flags. The best place to add these flags is in your Makefile(s).
The next thing that has to be done is to include the ESP-GDBStub source code in your project or link against the libgdbstub library.
Once you are ready with this you should include the gdbstub.h header in the file where the user_init function is declared and call gdbstub_init() in it. These two modifications should be included in your source code only when debug mode is enabled.
So let’s see how these recommendations were implemented in Sming. In order to follow the article you should clone the following project https://github.com/slaff/Sming and switch to the gdb-dev branch. On Linux the following command can be used:
git clone https://github.com/slaff/Sming.git -b feature/gdb-dev |
Once the cloning is done it will create a new subdirectory called Sming. Enter it and inside of it enter another subdirectory with the same name. On Linux you can execute:
cd Sming/Sming |
Then we need to get the latest ESP-GDBStub source code . This can be done by calling:
git submodule init git submodule update --recursive |
Up to here we should have all the source code needed to debug our projects. Now let’s look at the Makefile. In it there are lines instructing the build process to include the GDBStub code.
ifeq ($(ENABLE_GDB), 1) CFLAGS += -Og -ggdb -DGDBSTUB_FREERTOS=0 -DENABLE_GDB=1 MODULES += $(SMING_HOME)/gdbstub EXTRA_INCDIR += $(SMING_HOME)/gdbstub else CFLAGS += -Os -g endif |
These lines above will compile the Sming library with GDB support enabled. But in order to be able to use it in our application the source code of the application has also to be compiled with gdbstub. In the file Makefile-project.mk you will see similar lines:
ifeq ($(ENABLE_GDB), 1) CFLAGS += -Og -ggdb -DGDBSTUB_FREERTOS=0 -DENABLE_GDB=1 MODULES += $(SMING_HOME)/gdbstub EXTRA_INCDIR += gdbstub else CFLAGS += -Os -g endif |
The next important change is in the appinit/user_main.cpp file. You will see that we included there the recommended header and function call.
1 2 3 4 5 6 7 8 9 10 11 12 13 14 15 16 17 | #ifdef ENABLE_GDB #include "../gdbstub/gdbstub.h" #endif extern void init(); extern "C" void __attribute__((weak)) user_init(void) { system_timer_reinit(); uart_div_modify(UART_ID_0, UART_CLK_FREQ / 115200); cpp_core_initialize(); System.initialize(); #ifdef ENABLE_GDB gdbstub_init(); #endif init(); // User code init } |
In order to be able to use the Sming library in debug mode we have to compile it. Under linux the following commands should be executed
export ENABLE_GDB=1 make clean make |
Once the compilation is ready we can go to our demo application called Basic_Debug. From the current folder go one level above and from there enter the Basic_Debug folder. For Linux type the following command.
cd ../Basic_Debug |
This application is almost exact copy of Basic_Blink which is the “Hello World” application for microcontrollers. If you open the Basic_Debug/app/application.cpp file you will see one small difference though. The two functions in the file have GDB_IRAM_ATTR macro in their declaration. What this does is to instruct the compiler + linker to place the function code in RAM when the debug mode is enabled. That is needed because software debugging with ESP-GDBStub allows you set initial breakpoints only on code that is in RAM. Setting a breakpoint to code that is in FLASH will most certainly result in memory access violation during debugging. Interestingly enough you can set breakpoints in functions that are located in FLASH, but that can done after their first execution, not before that.
It is time to compile our application and flash it to the device. On Linux from the Basic_Debug directory execute these commands.
make clean ENABLE_GDB=1 make |
If you have correctly setup your development environment the two command should work as expected. (If you do not have one you can grab our Vagrant development environment.
Before flashing the code to the ESP make sure that it is in flash mode. For the Olimex and NodeMCU boards you will have to press the flash button and then turn off and on the ESP while holding the button pressed.
After that connect the ESP to your computer. In my case the device appears under /dev/ttyUSB0. Make sure that your current user can access the device. Under Linux this can be done by adding your current user to the dialout group (see https://github.com/slaff/esp8266.dev.box/blob/master/vm-bootstrap.sh#L111).
When you are ready to flash the device run the following command from the Basic_Debug directory.
make flash |
Live Debugging with GDB from Command Line
Once the new application/firmware is flashed on the device make sure to reset it. On NodeMCU I can press the reset button, but if you do not have such button just turn off and on the ESP.
Hopefully the ESP has been restarted. The first thing to notice here is that the LED will not blink. That is happening because our application stopped at a breakpoint that allows us to continue following the sequence of commands from here on.
Now we will try to debug using the command line GDB. The following explanations can be used as a crash course in remote debugging with GDB.
We need to start the open-source Xtensa GDB debugger. This can be done by typing
xtensa-lx106-elf-gdb -b 115200 |
The first command that needs to be executed is to load the file with the code
(gdb) file out/build/app.outThen we need to set some settings, like hardware limits
(gdb) set remote hardware-breakpoint-limit 1
(gdb) set remote hardware-watchpoint-limit 1
(gdb) set debug xtensa 4
And finally we need to connect to our device via the serial port.
(gdb) target remote /dev/ttyUSB0Gdb will show you the point at which the execution was stopped
Remote debugging using /dev/ttyUSB0
(trace) xtensa_unwind_pc (next_frame = 0x97f2120)
(info ) [xtensa_unwind_pc] pc = 0x40237c27
gdbstub_do_break_breakpoint_addr () at /home/slavey/dev/esp8266.dev.box/dev/Sming/Sming//gdbstub/gdbstub-entry.S:399
399     break 0,0
You can also see the source code where the execution has stopped. Typing …
(gdb) l… will return something like this
394     addi    a1, a1, -16
395     s32i    a15, a1, 12
396     mov     a15, a1
397
398 gdbstub_do_break_breakpoint_addr:
399     break 0,0
400
401     mov     a1, a15
402     l32i    a15, a1, 12
403     addi    a1, a1, 16
From here on you can set breakpoints. For example in the init function
(gdb) break initAnd finally you need to “continue” the execution by typing
(gdb) continueThe execution will stop at the first breakpoint that we have set:
Breakpoint 1, init () at app/application.cpp:22
22  {
And in here we can see information about variables. The following prints the value of the state variable.
(gdb) print state
$1 = true
And we can also go step-by step in that function by typing.
(gdb) nextYou can set as much software breakpoints as you want and display as much variables as needed.
Live Debugging with Eclipse CDT
A good visualization helps us understand things faster. What we can do is use Eclipse CDT and its debugging plugins to do remote debugging as we did from the command line.
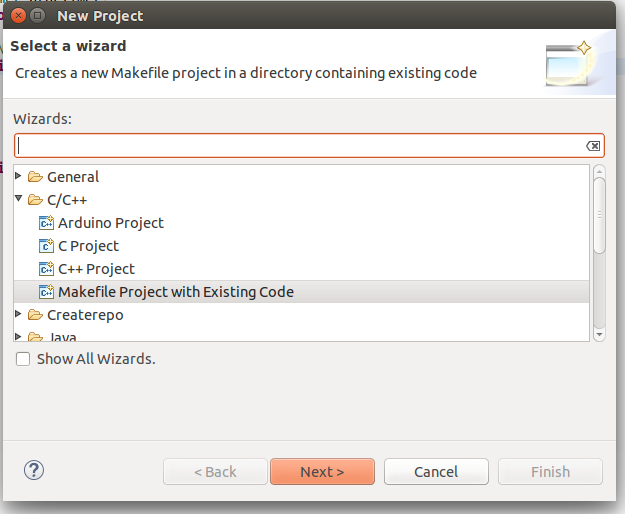
Here is how this can be done. Start Eclipse CDT. Then create two projects. One should contain the source code of the SmingFramework (Sming/Sming folder) and the other once should contain the Basic_Debug (Sming/Basic_Debug folder) source code. This can be done by calling File->New->Project->C/C++ -> Makefile Project with Existing Code
Once the two projects are in Eclipse set the Basic_Debug project to reference the Sming project.
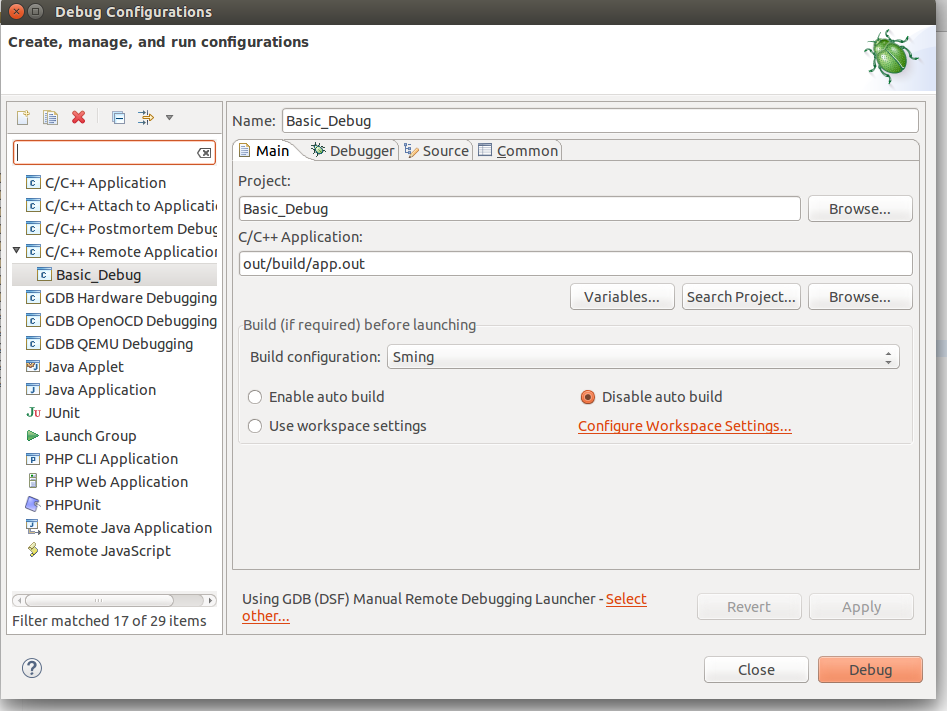
Now create a new Remote Debugging Configuration. This can be done from Run -> Debug Configurations -> C/C++ Remote Application. In there right click and create a new C/C++ Remote Application. In the Main tab set the Project to Basic_Build, the C/C++ Application to out/build/app.out and disable for now the auto build.
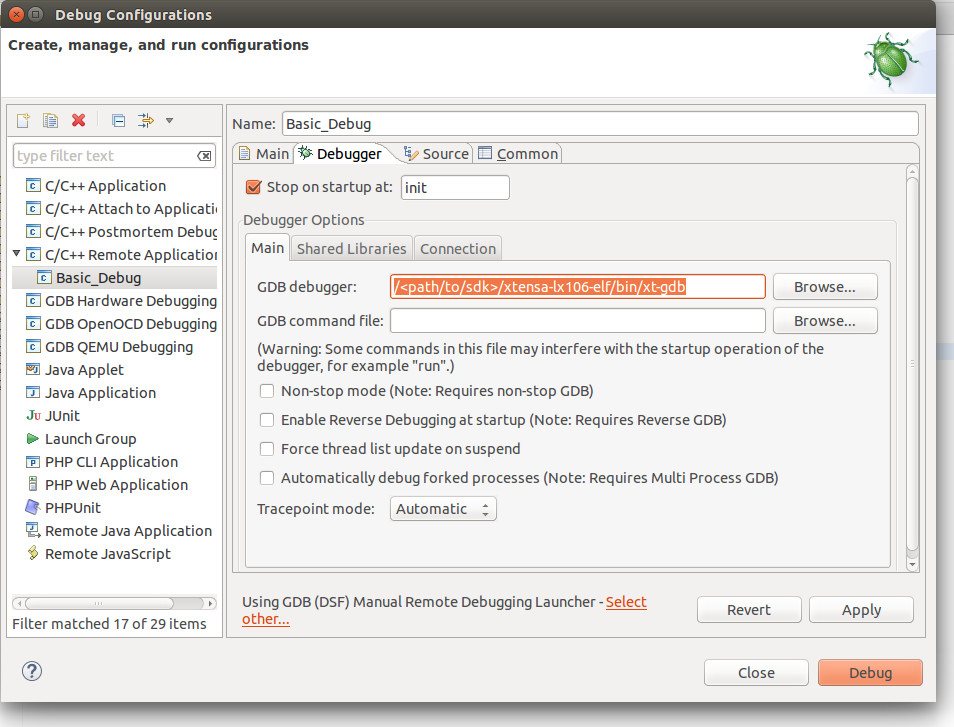
Then go to the Debugger tab and point the GDB debugger to your Xtensa-gdb binary.
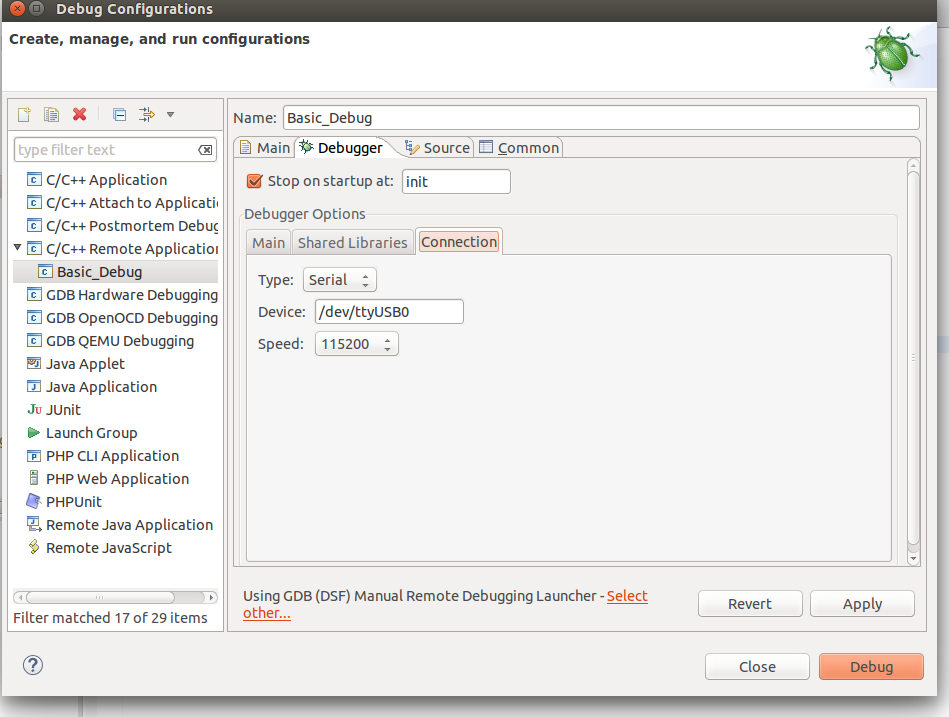
Finally we should configure the remote connection. Go to the Debugger->Connection tab and set the type to be Serial, the device to be /dev/ttyUSB0, or that ever you device is, and set the speed to 115200. As shown below.
We are ready now for debugging. Press the Debug button. In the screenshot above the Debug button is on the bottom-right corner. After some seconds your debugging session should be up and running and you can enjoy live debugging.
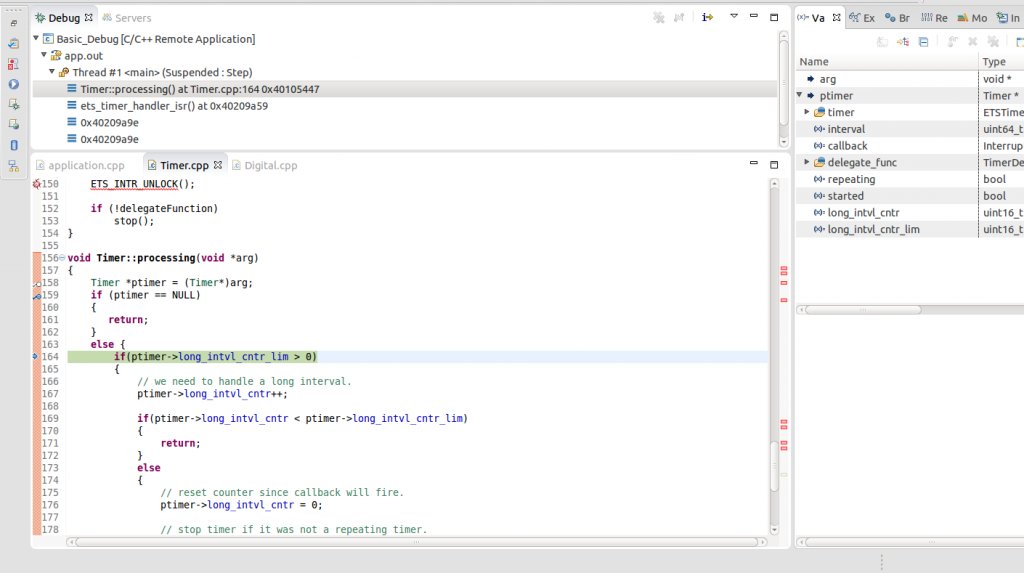
You will be able to see the current variables and their values. You should be able to go step by step, go inside of functions, add breakpoints to code in RAM or add breakpoints to code that was in FLASH, after it was executed executed at least once.
That’s all.
Final words
Being able to debug your application on an ESP8266 using open source tools is a game changer. It can save us a lot of money, time and effort finding issues and understanding how the device really works. And it makes the ESP8266 even more attractive for Maker enthusiasts than it already is.
Venkatesh
git clone https://github.com/slaff/Sming.git -b gdb-dev
There is no “gdb-dev” branch. I could only find “feature/gdb-dev”
admin
Thank you Venkatesh for noticing this. I will fix it in the article right away.
David
Great article!
Looks like the Sming example is not compiling due to type issues in gdbStub lib.
🙁
Chris
same problem here … type errors and multiple definitions when trying to build the gdbstub example ! any ideas ?
Martin
Great series; I’m trying to get this going on a non-framework setup i.e. raw SDK;
I get a “Error accessing memory address 0x4020e3bc: Input/output error.”; The user_init() is not cached in flash (i.e. lacks the ICACHE_FLASH_ATTR;
Any pointers?
esp8266@esp8266-VirtualBox:~/Share/hal$ ./xtensa-lx106-elf-gdb -b 115200

GNU gdb (crosstool-NG 1.20.0) 7.5.1

Copyright (C) 2012 Free Software Foundation, Inc.

License GPLv3+: GNU GPL version 3 or later

This is free software: you are free to change and redistribute it.

There is NO WARRANTY, to the extent permitted by law.  Type "show copying"

and "show warranty" for details.

This GDB was configured as "--host=i686-build_pc-linux-gnu --target=xtensa-lx106-elf".

For bug reporting instructions, please see:

.

(gdb) file build/httpd.user1.out

Reading symbols from /mnt/Share/hal/build/httpd.user1.out...done.

(gdb) set remote hardware-breakpoint-limit 1

(gdb) set remote hardware-watchpoint-limit 1

(gdb) set debug xtensa 4

(gdb) target remote /dev/ttyUSB0

Remote debugging using /dev/ttyUSB0

(trace) xtensa_unwind_pc (next_frame = 0x926dfb0)

(info ) [xtensa_unwind_pc] pc = 0x4021212b

gdbstub_do_break_breakpoint_addr () at esp-gdbstub/gdbstub-entry.S:399

399		break 0,0

(gdb) 1

Undefined command: "1".  Try "help".

(gdb) l

394		addi	a1, a1, -16

395		s32i	a15, a1, 12

396		mov		a15, a1

397

398	gdbstub_do_break_breakpoint_addr:

399		break 0,0

400

401		mov		a1, a15

402		l32i	a15, a1, 12

403		addi	a1, a1, 16

(gdb) break user_init

(trace) xtensa_alloc_frame_cache ()

(trace) call0_analyze_prologue (start = 0x4021212b, pc = 0x4021212b, ...)

(verb ) [call0_analyze_prologue] stopped at instr addr 0x4021212b, succeeded

(trace) xtensa_skip_prologue (start_pc = 0x4020e3bc)

(trace) xtensa_skip_prologue (start_pc = 0x4020e3bc)

(trace) xtensa_breakpoint_from_pc (pc = 0x4020e3bc)

Breakpoint 1 at 0x4020e3bc: file user/user_main.c, line 522.

(gdb) continue

Continuing.

(trace) xtensa_breakpoint_from_pc (pc = 0x4020e3bc)

(trace) xtensa_breakpoint_from_pc (pc = 0x4020e3bc)

Warning:

Cannot insert breakpoint 1.

Error accessing memory address 0x4020e3bc: Input/output error.
(gdb)
admin
(gdb) break user_init

...

Error accessing memory address 0x4020e3bc: Input/output error.
Hi Martin, most probably the user_init function is not in RAM but in FLASH. You need an attribute like this “__attribute__((section(“.iram.text”)))” to be added between the return type of the function and its name. For example:
void user_init() {
should be
void __attribute__((section(".iram.text"))) user_init() {
You can also write
#ifdef ENABLE_GDB

#define GDB_IRAM_ATTR __attribute__((section(".iram.text")))

#else

#define GDB_IRAM_ATTR

#endif
// ...
void GDB_IRAM_ATTR user_init() {
Nobodyman
xtensa-lx106-elf-gdb -b 115200
file build/blink.elf
set remote hardware-breakpoint-limit 1
set remote hardware-watchpoint-limit 1
set debug xtensa 4
target remote com7
output:
(trace) xtensa_unwind_pc (next_frame = 0x4c41070)
(info ) [xtensa_unwind_pc] pc = 0xe8762040
Register 42 is not available
0xe8762040 in ?? ()
Any hints what´s wrong?
admin
Get a newer version of gdb for xtensa. Read the posts from here for details https://github.com/SmingHub/Sming/pull/350
Nobodyman
Dear admin.
thank you for this reply. My problem that I posted was using gdb 7.10 in Windows 7.
In the meantime I tried gdb 7.5.1 in Linux and it works!
May I use an older version in Windows too? But how to build it?
I tried different approches but most of them don´t build version 7.5.1.
Andreas
Great work! Debugging works great for me with a ESP-12e!
Ilya
I followed instructions in parts 1-3 but I cannot find xtensa-lx106-elf-gdb. I only installed the Sming project in vagrant. I can compile and flash the chip with no problem.
How can I get the debugger installed?
admin
It should be located in /opt/Espressif/xtensa-lx106-elf/bin//xtensa-lx106-elf-gdb in your VM. If you physical machine has case-sensitive file system then look at Espressif/xtensa-lx106-elf/bin//xtensa-lx106-elf-gdb where `Espressif` is a subfolder of the folder in which the Vagrantfile is located.
Tomasz
I can’t make debugging work on ESP8266 but under Arduino. Arduino framework has implemented GDBStub of the same type as Sming. The problem is I cannot make online debug work.
1. I added include
2. Arduino framework calls gdb_init() by default
3. I use serial connection with baud set to 115200
4. Added -Og -ggdb
5. Used
(gdb) set remote hardware-breakpoint-limit 1
(gdb) set remote hardware-watchpoint-limit 1
(gdb) set debug xtensa 4
But all i get is :
Ignoring packet error, continuing…
warning: unrecognized item “timeout” in “qSupported” response
Any clue what I might not see or might be doing wrong ?
admin
Check if the application is working as expected or throwing fatal exceptions.
Pratik
Hello Have same problem please help me.
I implement gdbstub for my application for esp8266. As u suggested i have added -Og -ggdb flags .
In my main file i am generating exception by calling one task. but when i hit “target remote /dev/ttyUSB0” command in gdb ouput is as following:
Ignoring packet error, continuing…
warning: unrecognized item “timeout” in “qSupported” response
Ignoring packet error, continuing…
Ignoring packet error, continuing…
Bogus trace status reply from target: timeout
Please help me as soon as possible
admin
Can it be that your application is just segfaulting and causing the device to restart?
Sonia
I don’t see connection in the debug panel >> serial only have gdbserver as an option
Sonia
I cannot find your reference to:
Finally we should configure the remote connection. Go to the Debugger->Connection tab and set the type to be Serial, the device to be /dev/ttyUSB0, or that ever you device is, and set the speed to 115200. As shown below.
all I see is gdbserver
I that a configuration issue with eclipse?
Help Please
admin
Sonia, use the screenshots above for finding the right menu item.
Pingback:
Developer I/O » Live debugging ESP8266 with open-source toolsRavi Bhushan Yadav
Hi,
Is it possible to do profiling of a code based on ESP8266 using sming Framework?
By compiling using -pg Flag and xtensa-lx106-elf-gprof.
Please help in this regard.
Pratik
Hello,
I can not find Basic_Debug.
please help in this regards.
admin
The “Basic_Debug” sample is now part of the official `develop` version of Sming and can be found here: https://github.com/SmingHub/Sming/tree/develop/samples/Basic_Debug.
Just clone the latest Sming version and you will get everything needed to do the debugging.
hans musser
sigh. if there was an out-of-the-box debugging app that would be a game changer. Just hit the play button inside the arduino ide. By the time I am through this tutorial I have also done printfs…
mysran
Hello,
I am finding it difficult to Debug on Windows. Request help on that. Thanks for the blog.
Regards,
mysran
Mike
Hello, ive tried your tutorial and getting this errors after starting the debugger:
https://pastebin.com/CnYvXScD
Im trying out the LiveDebug sample. I think that Eclipse isnt detecting the Library from Sming Directory. The Sming Directory is added as Project Reference.